[blackcat] L3 Supply and Demand Zones MTFLevel: 3
Background
Supply and Demand represent the two most powerful forces of the market. Demand means the number of buyers buying a security in the market. Supply means the number of sellers selling a security in the market. Large supply takes the price to move down and large demand takes the price to move up. Balance in both forces will keep the price in sideways movement. There are two types of states of the price of a security in technical analysis. 1. Balanced state; 2. Unbalanced state. In a balanced state, the price is moving in a range like moving sideways. Simply means forces of buyers and sellers are balanced. Both of them don’t have the ability to create a trend either bearish or bullish trend. After breakout of this sideways (range) movement of price, imbalance in price occur. And after the breakout, the recent range will be called a base zone and the price will again come to this base zone to pick unfilled orders.
Function
This is a composite supply and demand zone indicator, which inlcude:
1. demand and supply zones: yellow color box for demand zone while fuchsia color box for supply zone
2. half-semi log based fibo levels
3. multiple time frame (MTF) manual or automatic setting to see clear trend
4. tendline drawing. Default 610 bars back to draw, you can change it to your preferred value. However, you need to guarantee the existing chart already have equal or more than the number of bars you set or 610 bars.
5. blackcat reveral labels
6. box color to indicate volume information as:
box border color is green --> bullish
box boarder color is red --> bearish
box body color meanings:
a. turquoise or aqua or cyan box body color --> no volume indicaor signal or NA --> no supply and demand signal
b. red box body color --> volume climax up - strong bullish high volume --> demand >> supply
c. white box body color --> volume climax down - strong bearish high volume --> supply >> demand
d. green box body color --> high volume churn - bars with high volume and low range --> suppy and demand is balancing
e. yellow box body color --> low Volume - bar for low volume --> bullish/bearish trend is exhausted, reversal may happen soon --> supply or demand dominance will be changed soon.
f. fuchsia box body color --> volume climax plus high volume churn --> two possibilities: red+green=fuchsia or white+green=fuchsia, so fuchsia is a mixed state --> srong demand with supply attack or strong supply with demand attack.
Remarks
Free but closed sourced.
If the trendline is not drawn but you can see the red resistance and green support dashed lines, please drag the the chart to the left unitl you see the yellow solid trend line appears.
This is the initial version. This will be contineously improved along time.
Search in scripts for "VOLUME BAR"

RVOL + Volume Z-Score (Textbook)This indicator is a relative-volume and “volume anomaly” dashboard designed to help you quickly spot when a ticker is actually in-play versus simply drifting on normal activity. It plots standard volume bars (colored by up/down candles) and overlays multiple optional smoothers of volume (SMA, LSMA/linear-regression MA, HMA, ALMA) so you can see whether participation is expanding or fading across different smoothing styles. It also calculates RVOL (current bar volume divided by the average volume over a user-defined lookback) and displays RVOL (and Z) in a small table for quick reference.
The core feature is a textbook volume z-score: Z=(V−SMA(V,N))/StDev(V,N)
This measures how far the current bar’s volume is from its recent average in standard-deviation units, making it easy to filter for genuinely unusual volume. The script plots mean + 1σ and mean + 2σ threshold bands and can highlight “anomaly” volume bars when Z exceeds your chosen σ thresholds (default 1σ for broader detection, with alerts available for 1σ/2σ). Use it as a participation filter: combine high RVOL / high Z with your price structure (key levels, VWAP, trend) to validate breakouts or identify high-conviction reversal/flush events.

HVPro Style IndicatorHVPro Style Indicator – Historical Volatility + Volume
HVPro Style Indicator is a combined volatility-and-volume tool designed to help traders visualize market expansion and contraction phases.
It calculates Historical Volatility (HV) using log-returns and a customizable lookback period, then smooths the result for a cleaner trend signal.
The script also includes a volume histogram, scaled by a multiplier, with bar colors changing based on whether volatility is rising or falling.
This makes it easy to spot moments when both volume and volatility align, often signaling trend transitions, breakouts, or exhaustion.
Features
✔ Historical Volatility calculation (annualized)
✔ Smoothed HV for cleaner visual trends
✔ Volume histogram with customizable multiplier
✔ Volume bar color shifts based on HV direction
✔ User-controlled visibility for both HV and volume
✔ Lightweight and optimized for all timeframes
How to Use
Rising HV (green volume bars) can indicate trend expansion or breakout momentum.
Falling HV (red bars) suggests contraction, ranging conditions, or volatility cooldown.
Watch for volatility shifts combined with volume spikes for potential trade entries.

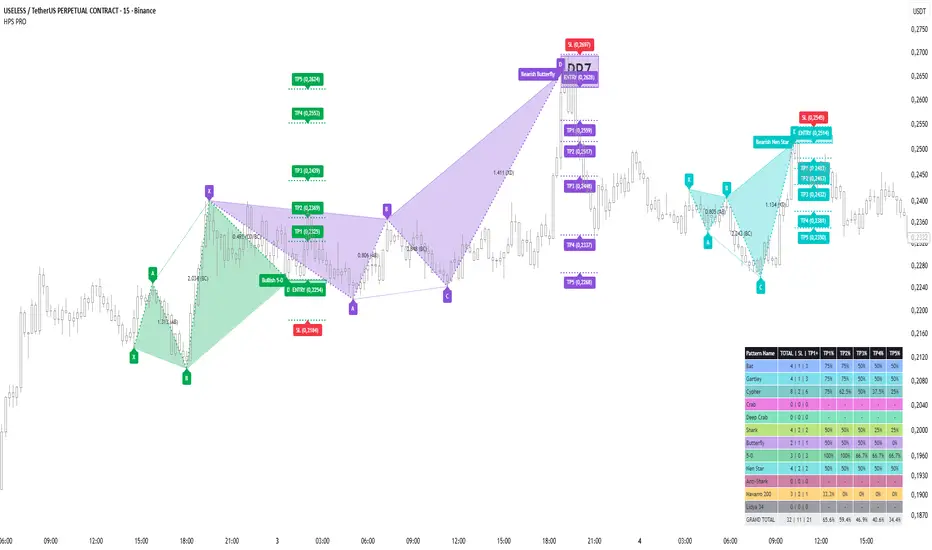
Harmonic Pattern Sniper PRO- Crypto Lidya🎯 Harmonic Pattern Sniper PRO (HPS PRO) — Crypto Lidya Edition
Professional Harmonic Pattern Detector, Alert & Backtest Engine
🔍 Overview
HPS PRO is a fully automated Harmonic Pattern Detection and Backtest System built for TradingView.
It detects 11 harmonic formations within seconds, draws PRZ (Potential Reversal Zone) boxes, calculates TP/SL levels, and displays performance statistics for each pattern.
📈 “HPS PRO doesn’t just detect patterns — it analyzes them statistically.”
🧩 Supported Patterns
1. Bat
2. Gartley
3. Cypher
4. Crab
5. Deep Crab
6. Butterfly
7. Shark
8. Anti-Shark
9. 5-0 Pattern
10. Nen Star
11. Navarro 200
Each pattern is detected for both bullish and bearish directions with user-defined deviation tolerances.
⚙️ Real-Time & Non-Redrawing
- Detects patterns before candle close (instant detection)
- Intrabar Hard-Lock prevents multiple detections on the same bar
- Snapshot Engine freezes entry levels — patterns never repaint in history
Real-time pattern detection before bar close with “lock” symbol
📸 Instant Detection Proof — Before & After Comparison
To demonstrate the real-time, non-repainting nature of HPS PRO, the following two screenshots show the pattern formation before and immediately after the D-bar closes.
The pattern appears live (before candle close), and the same formation remains visible after the bar closes — confirming zero repainting.
Before Candle Close (Instant Detection Preview):
After Candle Close (Confirmed Pattern, Same Structure):
💡 This comparison clearly proves that HPS PRO draws harmonic structures instantly at the D-bar without any delay or redraw.
🎯 Automated TP / SL Projection
Five Take Profit (TP1–TP5) levels and one Stop-Loss (SL) level are auto-calculated.
Two calculation engines available:
- Fibonacci Classic
- Fibonacci Custom (Crypto Lidya)
Each level has its own label, price display, and color transparency.
PRZ box and ENTRY label visually mark the potential reversal zone.
📊 Backtest Performance Panel
A fully integrated table summarizing each pattern’s success:
- Total formations detected
- SL count
- TP1–TP5 success rates
- Automatic Grand Total row
“Analyze each pattern’s win rate directly from your chart.”
🔔 Smart Alert System
- Edge-based trigger (alerts only once at the first detection)
- 3 alert categories:
1.) All Patterns (Any)
2.) Direction-Based (Bullish / Bearish)
3.) Per-Pattern alerts (e.g., Bullish Deep Crab)
Alert messages are bilingual by default:
EN: Bullish Bat detected.
TR: Boğa Bat formasyonu oluştu.
🧠 Intelligent Architecture
- Hash Pool: guarantees pattern uniqueness (no redraws)
- Snapshot Engine: locks ENTRY/BASE prices at first detection
- Garbage Collector: automatically manages drawing limits
- “Show Last Pattern” mode: displays only the latest formation
💡 Volume Intelligence
- Highlights bars with volume ≥ 2×, 3×, or 4× above average
- Paints candles by volume multiples
“Whale Alert” mode plots colored triangles for ultra-high volume bars
💼 Ideal For
✅ Technical analysts
✅ Harmonic pattern traders
✅ Algorithmic strategy developers
✅ Traders who value statistical validation
“HPS PRO ends the manual search era — every pattern, instantly and accurately.”
🔗 Developed by Crypto Lidya
🧠 “Don’t hunt patterns — let HPS PRO find them.”
📊 “Your backtest table reveals your strategy’s structure.”
🚀 “HPS PRO — The next evolution of harmonic trading.”
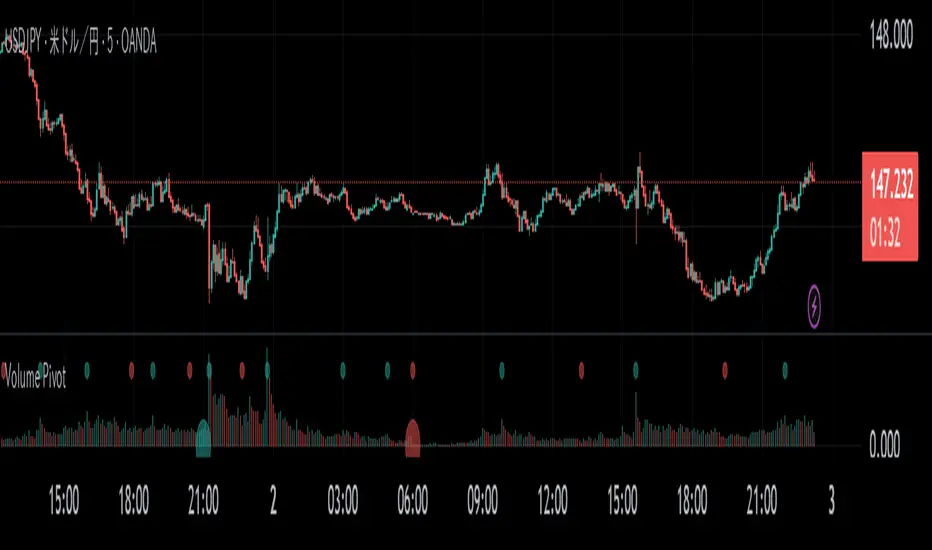
Volume PivotOVERVIEW
Volume Pivot is a technical analysis tool for TradingView designed to identify key turning points in the market by focusing on volume rather than price. It detects peaks and troughs (pivots) in trading volume to pinpoint moments of maximum market interest or exhaustion.
This indicator performs its analysis on both the Current Timeframe (CTF) and a user-defined Higher Timeframe (HTF). This dual-perspective approach allows traders to simultaneously grasp short-term market reactions and long-term structural shifts, leading to more informed and high-conviction trading decisions.
FEATURES
Automatic Pivot Detection
Automatically identifies and plots Volume Pivot Highs (peaks) and Pivot Lows (troughs) based on a user-defined Lookback Length.
Dual Timeframe Display
- CTF Signals : Plotted as tiny circles directly above the corresponding volume bars for immediate, short-term context.
- HTF Signals : Plotted as slightly larger circles at the bottom of the indicator pane, making them easy to distinguish as signals of higher significance.
Flexible HTF Configuration
Customize which higher timeframe to use for analysis based on your current chart timeframe. For example, you can set the indicator to reference the 1-hour chart as the HTF when you are on the 5-minute chart, and the Daily chart as the HTF when you are on the 1-hour chart.
Intuitive Volume Bars
The volume bars are color-coded to show whether volume is increasing (bullish color) or decreasing (bearish color) compared to the previous bar, offering a quick visual gauge of market momentum.
Full Customization
Easily toggle the visibility of CTF and HTF signals and customize the colors for bullish and bearish pivots to match your charting preferences.
RAMS TrapMaster ConfluenceOverview:
The TrapMaster Confluence indicator is a tactical multi-factor confirmation system designed to identify high-probability intraday and swing trade setups. It aligns multiple technical signals—momentum, trend, volume, and price action—to generate a clear bias score. By requiring confluence across several dimensions, it filters out weak or noisy signals and highlights trades with broader technical agreement. This tool is tailored for semi-advanced retail traders across equities, futures, and crypto who seek objective, structured confirmations before entering a position.
Confluence Components:
RSI (Relative Strength Index):
Evaluates momentum strength and trend bias. The script dynamically checks for crossovers at the 50 midline and extreme overbought/oversold zones to determine directional pressure.
MACD (Moving Average Convergence Divergence):
Detects momentum shifts using signal line crossovers and MACD histogram polarity. The script uses MACD direction and histogram flips to contribute to bullish or bearish pressure.
SMA 5 vs. SMA 20:
Captures short-term trend shifts via fast–slow moving average crossovers. A rising 5-SMA over a falling 20-SMA supports a bullish thesis and vice versa.
SMA 50 vs. SMA 200:
Used to confirm longer-term trend bias (e.g. golden cross or death cross) and add weight to the broader market structure.
SMA 5 Trend Direction:
Assesses immediate trend slope. An upward or downward slope of the 5-SMA confirms recent price acceleration or deceleration.
Volume Spike:
Flags high-volume price moves, helping validate whether momentum is supported by institutional participation or liquidity interest.
Rising Volume Bars:
Confirms directional strength through consistent increases in volume during trends. Sustained rising volume suggests growing conviction.
VWAP (Volume-Weighted Average Price):
Anchors price to institutional average cost per session. Price above VWAP typically indicates bullish sentiment; below signals bearish sentiment.
Candlestick Confirmation:
Confirms signals using recent price action (e.g. engulfing candles, breakouts with volume). Adds an extra layer of price behavior validation.
Contrarian Mode (Optional):
This feature flips the typical logic to catch high-probability reversal zones. When many signals align in one direction, contrarian mode allows the user to search for exhaustion points in sentiment or momentum, potentially capturing mean reversions.
Each confluence factor contributes a vote to a composite bias count. Users define a threshold (e.g., 4 out of 6 conditions) to trigger a signal. The indicator does not rely on any one signal, but instead rewards alignment across multiple technical aspects.
Signal Generation & Alerts:
When the defined confluence threshold is met, a signal label appears on the chart with directional context (long or short). Alerts can be tied to these signals, allowing the user to be notified in real time when actionable setups occur. The system supports “next candle confirmation,” which delays signal printing until the bar closes, minimizing premature alerts. All labels are limited to the most recent few to reduce chart clutter.
Dashboard Overview:
The optional real-time dashboard shows which confluence components are active on the current candle. This visual panel is customizable, updating dynamically and remaining hidden when no conditions are met. It includes:
Each factor with active/inactive status
Current bullish and bearish score counts
Real-time snapshot of bias development
Customization & Controls:
All components can be toggled on or off. Traders can choose to require stricter or looser confirmation thresholds. Label visibility, signal timing, and dashboard position/size are fully adjustable. This allows the indicator to adapt across timeframes and trading styles — whether scalping or swing trading.
Suggested Use with Trendlines and support and resistance:
TrapMaster becomes significantly more powerful when used alongside manual or automated support/resistance and trendline analysis. Confluence signals occurring near:
major support zones,
resistance levels,
trendline retests.
Fibonacci retracements,
help validate the price’s reaction to those areas. Traders can pre-mark key price zones, then use TrapMaster to confirm entries as momentum builds at those levels. This strengthens conviction and supports timing decisions when structure and indicators align.
Why It’s Different:
Most scripts offer a single signal or simplistic crossover logic. TrapMaster offers multi-dimensional logic that evaluates a comprehensive set of confluence factors—each customizable—with real-time logic that updates on every bar. The built-in dashboard provides a highly readable tactical summary. Its optional contrarian bias engine, dashboard visuals, factor-level customization, and risk-filtering logic (e.g. delayed confirmation and volume context) make it a flexible and advanced system not commonly found in traditional retail indicators.
Disclaimers:
This tool is for educational and analytical use only. It is not intended as trading or financial advice. All trading carries risk, and past performance is not indicative of future results. Always use proper risk management and conduct your own independent analysis before making trading decisions.
Developed by: TRAPPER-RAMS
Jul 24
Release Notes
This is the official update to RAMS TrapMaster Confluence, featuring massive enhancements across visual clarity, confluence accuracy, and real-time alert precision.
What's New:
Accurate Confluence Dashboard
Triple-row layout: Bullish , Bearish , and clear headers
Bull/Bear condition separation for total clarity
SMA 5/20 & 50/200 cross states tracked and displayed
Fully Integrated Alerts
Alerts for 5/20 and 50/200 SMA crosses
Bullish 💸 and Bearish 💰 confluence entry alerts
Instant trigger-ready setup
Visual Label Overhaul
💸 = Buy Signal (normal mode)
💰 = Sell Signal (normal mode)
🧨 = Contrarian Bull Flip
💣 = Contrarian Bear Flip
Cross labels show exact bar: "5/20 X", "50/200 X"
CoolDown & Memory-Efficient Label Logic
• Configurable label cooldown per N bars
• Old signals auto-deleted to prevent overflow
Use Cases:
This update is ideal for traders looking for precision entry timing, while understanding the full bull/bear backdrop in real-time.

Volume Surge Detector[SpeculationLab]Volume Surge Detector
This tool is especially useful for spotting early signs of breakouts, news-driven spikes, or institutional activity that are often preceded by abnormal surges in volume.
For better chart readability, the volume bar colors are based on TradingView’s original Volume indicator, while all other code is fully original by Speculation Lab.
You can customize both the SMA line and the volume bar colors to fit your style.
The logic compares the current volume against its SMA (default length: 14, fully adjustable).
The script comes with two surge levels:
Surge Level 1 (default = 5) → When volume is more than 5× the SMA, the bar turns aqua.
Surge Level 2 (default = 10) → When volume is more than 10× the SMA, the bar turns yellow.
It also includes built-in alerts, so you’ll be notified instantly whenever a surge is detected.
This makes it easier to spot potential breakout moves or large market participation in real time.
Disclaimer: This script is for educational purposes only. It does not provide financial advice.
这是一个用于探测 成交量爆发 的指标。
为了图表美观,成交量柱的颜色借鉴了 TradingView 原始 Volume 指标,其余代码均为 Speculation Lab 原创。
用户可以自由调整成交量柱和其对应的 SMA 均线的颜色。
指标通过对比成交量和其 SMA(默认长度为14,可自定义长度和颜色)的比例来检测放量。
默认设置了两个放量级别:
Surge Level 1(默认=5):当成交量超过均量的 5 倍时,量柱变为水蓝色。
Surge Level 2(默认=10):当成交量超过均量的 10 倍时,量柱变为黄色。
脚本还设置了 内置警报功能,方便交易者在出现放量时实时收到通知。

Volume pressure by GSK-VIZAG-AP-INDIA🔍 Volume Pressure by GSK-VIZAG-AP-INDIA
🧠 Overview
“Volume Pressure” is a multi-timeframe, real-time table-based volume analysis tool designed to give traders a clear and immediate view of buying and selling pressure across custom-selected timeframes. By breaking down buy volume, sell volume, total volume, and their percentages, this indicator helps traders identify demand/supply imbalances and volume momentum in the market.
🎯 Purpose / Trading Use Case
This indicator is ideal for intraday and short-term traders who want to:
Spot aggressive buying or selling activity
Track volume dynamics across multiple timeframes *1 min time frame will give best results*
Use volume pressure as a confirming tool alongside price action or trend-based systems
It helps determine when large buying/selling activity is occurring and whether such behavior is consistent across timeframes—a strong signal of institutional interest or volume-driven trend shifts.
🧩 Key Features & Logic
Real-Time Table Display: A clean, dynamic table showing:
Buy Volume
Sell Volume
Total Volume
Buy % of total volume
Sell % of total volume
Multi-Time frame Analysis: Supports 8 user-selectable custom time frames from 1 to 240 minutes, giving flexibility to analyze volume pressure at various granularities.
Color-Coded Volume Bias:
Green for dominant Buy pressure
Red for dominant Sell pressure
Yellow for Neutral
Intensity-based blinking for extreme values (over 70%)
Dynamic Data Calculation:
Uses volume * (close > open) logic to estimate buy vs sell volumes bar-by-bar, then aggregates by timeframe.
⚙️ User Inputs & Settings
Timeframe Selectors (TF1 to TF8): Choose any 8 timeframes you want to monitor volume pressure across.
Text & Color Settings:
Customize text colors for Buy, Sell, Total volumes
Choose Buy/Sell bias colors
Enable/disable blinking for visual emphasis on extremes
Table Appearance:
Set header color, metric background, and text size
Table positioning: top-right, bottom-right, etc.
Blinking Highlight Toggle: Enable this to visually highlight when Buy/Sell % exceeds 70%—a sign of strong pressure.
📊 Visual Elements Explained
The table has 6 rows and 10 columns:
Row 0: Headers for Today and TF1 to TF8
Rows 1–3: Absolute values (Buy Vol, Sell Vol, Total Vol)
Rows 4–5: Relative percentages (Buy %, Sell %), with dynamic background color
First column shows the metric names (e.g., “Buy Vol”)
Cells blink using alternate background colors if volume pressure crosses thresholds
💡 How to Use It Effectively
Use Buy/Sell % rows to confirm potential breakout trades or identify volume exhaustion zones
Look for multi-timeframe confluence: If 5 or more TFs show >70% Buy pressure, buyers are in control
Combine with price action (e.g., breakouts, reversals) to increase conviction
Suitable for equities, indices, futures, crypto, especially on lower timeframes (1m to 15m)
🏆 What Makes It Unique
Table-based MTF Volume Pressure Display: Most indicators only show volume as bars or histograms; this script summarizes and color-codes volume bias across timeframes in a tabular format.
Customization-friendly: Full control over colors, themes, and timeframes
Blinking Alerts: Rare visual feature to capture user attention during extreme pressure
Designed with performance and readability in mind—even for fast-paced scalping environments.
🚨 Alerts / Extras
While this script doesn’t include TradingView alert functions directly, the visual blinking serves as a strong real-time alert mechanism.
Future versions may include built-in alert conditions for buy/sell bias thresholds.
🔬 Technical Concepts Used
Volume Dissection using close > open logic (to estimate buyer vs seller pressure)
Simple aggregation of volume over custom timeframes
Table plotting using Pine Script table.new, table.cell
Dynamic color logic for bias identification
Custom blinking logic using na(bar_index % 2 == 0 ? colorA : colorB)
⚠️ Disclaimer
This indicator is a tool for analysis, not financial advice. Always backtest and validate strategies before using any indicator for live trading. Past performance is not indicative of future results. Use at your own risk and apply proper risk management.
✍️ Author & Signature
Indicator Name: Volume Pressure
Author: GSK-VIZAG-AP-INDIA
TradingView Username: prowelltraders

VCBBDOVWAPSMA By Anil ChawraHow Users Can Make Profit Using This Script:
1. Volume Representation : Each candle on the chart represents a specific time period (e.g., 1 minute, 1 hour, 1 day) and includes information about both price movement and trading volume during that period.
2. Candlestick Anatomy : A volume candle has the same components as a regular candlestick: the body (which represents the opening and closing prices) and the wicks or shadows (which indicate the highest and lowest prices reached during the period).
3. Volume Bars : Instead of just the candlestick itself, volume candles also include a bar or histogram representing the trading volume during that period. The height or length of the volume bar indicates the amount of trading activity.
4. Interpreting Volume : High volume candles typically indicate increased market interest or activity during that period. This could be due to significant buying or selling pressure.
5. Confirmation : Traders often look for confirmation from other technical indicators or price action to validate the significance of a high volume candle. For example, a high volume candle breaking through a key support or resistance level may signal a strong market move.
6. Trend Strength : Volume candles can provide insights into the strength of a trend. A series of high volume candles in the direction of the trend suggests strong momentum, while decreasing volume may indicate weakening momentum or a potential reversal.
7. Volume Patterns : Traders also analyze volume patterns, such as volume spikes or divergences, to identify potential trading opportunities or reversals.
8. Combination with Price Action: Volume analysis is often used in conjunction with price action analysis and other technical indicators to make more informed trading decisions.
9. Confirmation and Validation: It's important to confirm the significance of volume candles with other indicators or price action signals to avoid false signals.
10. Risk Management : As with any trading strategy, proper risk management is crucial when using volume candles to make trading decisions. Set stop-loss orders and adhere to risk management principles to protect your capital.
How to script works :
1.Identify High Volume Candles: Look for candles with significantly higher volume compared to the surrounding candles. These can indicate increased market interest or activity.
2.Wait for Confirmation: Once you identify a high volume candle, wait for confirmation from subsequent candles to ensure the momentum is sustained.
3.Enter the Trade: After confirmation, consider entering a trade in the direction indicated by the high volume candle. For example, if it's a bullish candle, consider buying.
4.Set Stop Loss: Always set a stop loss to limit potential losses in case the trade goes against you.
5.Take Profit: Set a target for taking profits. This could be based on technical analysis, such as a resistance level or a certain percentage gain.
6.Monitor Volume: Continuously monitor volume to gauge the strength of the trend. Decreasing volume may signal weakening momentum and could be a sign to exit the trade.
7.Risk Management: Manage risk carefully by adjusting position sizes according to your risk tolerance and the size of your trading account.
8.Review and Adapt: Regularly review your trades and adapt your strategy based on what's working and what's not.
Remember, no trading strategy guarantees profits, and it's essential to practice proper risk management and have realistic expectations. Additionally, consider combining volume analysis with other technical indicators for a more comprehensive approach to trading.
**How Users Can Make Profit Using This Script:
**
DAYS OPEN LINE:
1.Purpose: Publishing a "Days Open Line" indicator serves to inform customers about the operational schedule of a business or service.
2.Visibility: It ensures that the information regarding the days of operation is easily accessible to current and potential customers.
3.Transparency: By making the operational schedule public, businesses demonstrate transparency and reliability to their customers.
4.Accessibility: The indicator should be published on various platforms such as the business website, social media channels, and physical locations to ensure accessibility to a wide audience.
5.Clarity: The information should be presented in a clear and concise manner, specifying the days of the week the business is open and the corresponding operating hours.
6.Updates: It's important to regularly update the "Days Open Line" indicator to reflect any changes in the operational schedule, such as holidays or special events.
7.Customer Convenience: Providing this information helps customers plan their visits accordingly, reducing inconvenience and frustration due to unexpected closures.
8.Expectation Management: Setting clear expectations regarding the business hours helps manage customer expectations and reduces the likelihood of disappointment or complaints.
9.Customer Service: Publishing the "Days Open Line" indicator demonstrates a commitment to customer service by ensuring that customers have the information they need to engage with the business.
10.Brand Image: Consistently .maintaining and updating the indicator contributes to a positive brand image, as it reflects professionalism, reliability, and a customer-centric approach.
SMA CROSS:
1.This indicator generates buy and sell signals based on the crossover of two Simple Moving Averages (SMA): a shorter 3-day SMA and a longer 8-day SMA.
When the 3-day SMA crosses above the 8-day SMA, it generates a buy signal indicating a potential upward trend.
Conversely, when the 3-day SMA crosses below the 8-day SMA, it generates a sell signal indicating a potential downward trend.
Signal Interpretation:
2.Buy Signal: Generated when the 3-day SMA crosses above the 8-day SMA.
Sell Signal: Generated when the 3-day SMA crosses below the 8-day SMA.
Usage:
3.Traders can use this indicator to identify potential entry and exit points in the market.
Buy signals suggest a bullish trend, indicating a favorable time to enter or hold a long position.
4.Sell signals suggest a bearish trend, indicating a potential opportunity to exit or take a short position.
Parameters:
5.Periods: 3-day SMA and 8-day SMA.
Price: Closing price is commonly used, but users can choose other price types (open, high, low) for calculation.
Confirmation:
6.It's recommended to use additional technical analysis tools or confirmatory indicators to validate signals and minimize false signals.
Risk Management:
7.Implement proper risk management strategies, such as setting stop-loss orders, to mitigate losses in case of adverse price movements.
Backtesting:
8.Before using the indicator in live trading, conduct thorough backtesting to evaluate its effectiveness under various market conditions.
Considerations:
9.While SMA crossovers can provide valuable insights, they may generate false signals during ranging or choppy markets.
Combine this indicator with other technical analysis techniques for comprehensive market analysis.
Continuous Optimization:
10.Monitor the performance of the indicator and adjust parameters or incorporate additional filters as needed to enhance accuracy over time.
BOLLINGER BAND:
1.Definition: A Bollinger Band indicator is a technical analysis tool that consists of a centerline (typically a moving average) and two bands plotted above and below it. These bands represent volatility around the moving average.
2.Purpose: Publishing a Bollinger Band indicator serves to provide traders and investors with insights into the volatility and potential price movements of a financial instrument.
3.Visualization: The indicator is typically displayed on price charts, allowing users to visualize the relationship between price movements and volatility levels.
4.Interpretation: Traders use Bollinger Bands to identify overbought and oversold conditions, potential trend reversals, and volatility breakouts.
5.Components: The indicator consists of three main components: the upper band, lower band, and centerline (usually a simple moving average). These components are calculated based on standard deviations from the moving average.
6.Parameters: Traders can adjust the parameters of the Bollinger Bands, such as the period length and standard deviation multiplier, to customize the indicator based on their trading strategy and preferences.
7.Signals: Bollinger Bands generate signals when prices move outside the bands, indicating potential trading opportunities. For example, a price breakout above the upper band may signal a bullish trend continuation, while a breakout below the lower band may indicate a bearish trend continuation.
8.Confirmation: Traders often use other technical indicators or price action analysis to confirm signals generated by Bollinger Bands, enhancing the reliability of their trading decisions.
9.Education: Publishing Bollinger Band indicators can serve an educational purpose, helping traders learn about technical analysis concepts and how to apply them in real-world trading scenarios.
10.Risk Management: Traders should exercise proper risk management when using Bollinger Bands, as false signals and market volatility can lead to losses. Publishing educational content alongside the indicator can help users understand the importance of risk management in trading.
VWAP:
1.Calculation: VWAP is calculated by dividing the cumulative sum of price times volume traded for every transaction (price * volume) by the total volume traded.
2.Time Frame: VWAP is typically calculated for a specific time frame, such as a trading day or a session.
3.Intraday Trading: It's commonly used by intraday traders to assess the fair value of a security and to determine if the current price is above or below the average price traded during the day.
4.Execution: Institutional traders often use VWAP as a benchmark for executing large orders, aiming to buy at prices below VWAP and sell at prices above VWAP.
5.Benchmark: It serves as a benchmark for traders to evaluate their trading performance. Trades executed below VWAP are considered good buys, while those above are considered less favorable.
6.Sensitivity: VWAP is more sensitive to price and volume changes during periods of high trading activity and less sensitive during periods of low trading activity.
7.Day's End: VWAP resets at the end of each trading day, providing a new reference point for the following trading session.
8.Volume Weighting: The weighting by volume means that prices with higher trading volumes have a greater impact on VWAP than those with lower volumes.
9.Popular with Algorithmic Traders: Algorithmic trading systems often incorporate VWAP strategies to execute trades efficiently and minimize market impact.
10.Limitations: While VWAP is a useful indicator, it's not foolproof. It may lag behind rapidly changing market conditions and may not be suitable for all trading strategies or market conditions. Additionally, it's more effective in liquid markets where there is significant trading volume.

HTF Volume by Prosum SolutionsOverview of Features
This indicator was inspired by the work of "LonesomeTheBlue" in the script called "Volume Multi Time Frame" . This script will provide a highly customizable interface to specify the higher timeframe period for the volume with the ability to link to the "HTF Candles by Prosum Solutions" indicator using the "HTF Setting Code" data point, as well as adjusting various styling options for the volume bar color fill and border.
Usage Information
The indicator can be applied to any chart at any time frame. When the "Chart" option is chosen for the "Timeframe" field, the indicator will attempt to find a higher timeframe resolution to ensure the volume bars are drawn. The indicator will simply accumulate the volume value for each candlestick bar and reset when the new high timeframe period has started. The color of the volume bars are relative to the higher timeframe setting so that you can visually interpret when the volume in a rising or falling state relative to the higher timeframe price action.
If you choose to add the "HTF Candles by Prosum Solutions" indicator, you can link this indicator to it by choosing the "HTF Candles" option for the "Timeframe Source" field and then choosing the "HTF Setting Code" option for the "HTF Candles" field. At this point, whenever you adjust the high timeframe setting in the "HTF Candles by Prosum Solutions" indicator, this indicator will automatically adjust the timeframe to match it, thereby reducing the steps you need to take to keep the two indicators in sync.
Enjoy! 👍

Volume [Educational]Hello All,
This is an educational work and it's developed to show how to write scripts that will work like built-in volume indicator.
We have new features in Pine Script™ Language, such chart.bg_color, chart.fg_color, chart.left_visible_bar_time, chart.right_visible_bar_time and many more. Many Thanks to Tradingview and Pine Team for such great additions!
You can find more information about these new functions here .
How the script works?
- At the first step it calculates how many visible bar on the chart by using chart.right_visible_bar_time and chart.left_visible_bar_time functions.
- Calculates the zero line for the volume
- Finds maximum volume on visible area and normalize all volume values
- Draws volume bars
- Shows volume info as indicator value. in this step it uses chart.fg_color and plotarrow() commands to show the values in optimum color.
In order to place the indicator at the bottom of the chart, Please set Bottom Margin = 0 as shown in the following screenshot:
You can change the volume bar colors optionally.
An Example screenshot with different volume bar colors:
Enjoy!

SIB Fuel moves Car, Volume moves PriceVolume is important as fuel for a vehicle, without fuel a vehicle wouldn't move. We strongly believe a stock required volumes momentum in order to take-off the rallies.
This indicator helps to spot when the "Big Player" comes into the market, neither the collection stage nor the rally take-off stage.
No single indicator will work effectively by itself. Hence, we developed this unique "Heat Volume" indicator to compliment the candlestick analysis.
[EXPLANATION}
GREEN VOLUME BAR: Volume greater than the previous day volume.
GRAY VOLUME BAR: Volume lesser than the previous day volume.
RED VOLUME BAR: Presence of "Big Player" in the market.
YELLOW-BACKGROUND: Strong & active market trade sentiment in Daily timeframe.
GREEN-BACKGROUND: Strong & active market trade sentiment in Weekly timeframe.
WHITE-BACKGROUND: Strong & active market trade sentiment in Monthly timeframe.
ORANGE-BACKGROUND: Strong & active market trade sentiment in Hourly & Minutes timeframe.
Watch on the "Red" volume bar on the critical point. E.g. trend reversal, gap-up, resistance/price/box breakout.
This signaled the "Big Players" in the trade to take-off the rally.
Watch on the "Color-background" signaled of the strong & active market trade sentiment in the respective timeframe.
When "No-color Background" (Black) Stand aside when market trade sentiment is low and quiet.
Disclaimer:-
-This indicator is provided as best as it's an effort for the purpose of studying in the Technical Analysis perspective.
-This is not and never a trading suggestion of buy/sell call or decision under any circumstances.
-This indicator is for the member's and subscriber's circulation only. *If you are interested in the indicator, kindly contact us for the Free-Trial.
-Good luck & Happy Charting!

Volume by MetalBeeThis is a modified volume indicator modeled on the standard indicator with some conditional formats applied:
* "Volume High" input allows the user to designate the number of periods to look backwards to find a value for the highest volume day
* Where the bar volume is greater than the value returned for the "volume high", the volume bar will be colored purple
* Where the bar volume is greater than the value returned for the "simple moving average", the volume bar will be colored blue

Slippage Calculator Hello everyone,
This is the first script I publish, also my English is not the best my apologies.
This simple study script is an attempt to estimate the slippage during a trade. By no means it is a precise calculation, it is just an approach that can be improved.
You are welcome to take this simple script and use it and change it at your convenience just ask your acknowledge.
My approach considers the total fluctuation the price gets as a consequence for the total volume on that specific bar.
The volume on each bar is given in BTC, thus you get that by using the formula.
vol = volume * vwap
The total variation in price is considered as twice the size of the bar plus the gap between to consecutive bars. that is the
total fluctuation of price on each bar = (2 * (high - low) + abs(open - close )) which is not totally true since inside each bar price can fluctuate a lot more.
The script considers you are trading your total equity (eq_BTC ) each time. The fraction of your equity of the volume bar is eq_BTC / vol
Then eq_BTC / vol is the portion or the total fluctuation in price that is due to your entry or exit from the market.
(2 * (high - low) + abs(open - close )) * eq_BTC / vol
is the average change in price due you enter o exit a position.
** the 2 factor accounts for the two directions in the market buying and selling. There is more behind this formula I can explain you in more detail if you like.
I haven't seen anywhere a formula like this one, so it is intended to be a first attempt to get a better approach.
Finally the output of the scripts is how many ticks the price might change due to your trade on each bar
round(slippage/syminfo.mintick)
The script is focused in crypto but it can be used as well on forex markets.
Take care,
@yvponce

VSA Volume IndicatorThis indicator is build around volume (Ticks) and abnormalities:
The indicator consists of a
- Histogram
- A wave above the histogram
- Colored circles in the top of the indicator pane
- Colored squares below the histogram
- Colored Background
The volume histogram:
Black volume : difference between open and close is less then 0.1 pip
Blue : price movement is bullish
Red : price movement is bearish
Pink : volume is less then previous 2 bars
The Wave above the histogram
Based upon the settings:
Lookback period - standard at 10
Period for the SMA - standard at 14
Factor bottom Wave - standard at 2.2
Factor top Wave - standard at 3.5
A pink wave is plotted above the volume bars, the main driver of this wave is a relation/calculation between the factors, the lookback period and the SMA to the volume
Additional 2 black lines are plotted using the standard deviation as a basis
Colored circles in the top of the indicator pane
In the top of the indicator pane circles are plotted with the following rational
For each 1min the indicator calculates if the volume belongs to a bullish or bearish price movement and sums this for the selected time frame.
as example if the time frame is set to 60min :
for the 60x 1min candles the volume is added to bears or bulls
if of the total volume 53% or more belongs to bears or bulls a circle is plotted. The 53% can be adjusted in the settings
Red for Bears
Green for Bulls
If their is a contradiction the price candles body becomes hollow
Contradiction :
Volume for the selected timeframe is concluded to be Bullish but the price is Bearish => price candle will be hollow
Volume for the selected timeframe is concluded to be Bearish but the price is Bullish => price candle will be hollow
Colored squares below the histogram
the average volume is calculated of the 5 previous candles of that time. If this volume is higher then the actual volume and the actual volume is labelled UHV a blue square is plotted
as example on a 1hr time frame
- 17:00 volume 1.000
- the average of the last 5 times at 17:00 the volume is 1.200
- the current volume crosses the bottom of the wave => UHV
An orange square is plotted as an indication of an abnormality being UHV but the volume is below the average volume of the last 5x volume bars at that time
A red line is plotted to indicate the average of the '5 day - specific time' volume
A black square is plotted when:
- UHV condition is met : volume crosses the bottom of the wave
- 3x consecutive volume increase with 3x consecutive bullish or bearish price movement.
This as an indication that the background color as explained below is 'special'
Colored Background
If volume crosses the bottom wave, Ultra High Volume (UHV) has been detected and the background is colored.
Light red : UHV on bearish price movement
Light blue : UHV on bullish price movement
If volume increases 3 times consecutive and price is bearish 3 x consecutive then the background is colored Orange
If volume increases 3 times consecutive and price is bullish 3 x consecutive then the background is colored Dark Blue
Any feedback is welcome

Volume Pulse [BreakoutOrFakeout]Volume Pulse
What It Is
A beautifully designed volume indicator that transforms standard volume bars into an intelligent, visually stunning analysis tool. It instantly highlights when "smart money" is moving and helps identify real breakouts from fakeouts.
What Makes It Special
Visual Intelligence: Uses gradient color technology that intensifies based on volume strength - weak volume appears transparent while strong volume pops with vibrant colors. You'll literally SEE the difference between retail and institutional activity.
Spike Detection: Automatically identifies and marks unusual volume surges with golden diamond markers - these often precede major price moves.
Dynamic Adaptation: The moving average line intelligently changes opacity based on current volume conditions, creating a living, breathing indicator that responds to market activity.
Real-Time Stats: Floating information panel shows current volume compared to average with percentage changes - no mental math required.
How to Use It
Color Intensity = Volume Strength
Faded bars = Weak volume (potential fakeout)
Solid bars = Strong volume (potential breakout)
Golden Diamonds = Pay Attention
Mark 2x average volume spikes
Often appear at reversal points or breakout confirmations
Blue Line Relationship
Volume above line = Increasing interest
Volume below line = Declining participation
Background Highlights
Subtle yellow glow on extreme volume days
Makes significant days impossible to miss
Perfect For
Confirming breakout validity
Spotting accumulation/distribution
Identifying climax tops/bottoms
Day trading volume patterns
Swing trading entry confirmation
Why Traders Love It
✓ Makes volume analysis actually enjoyable
✓ Clean design reduces chart clutter
✓ Works on all timeframes
✓ No complex settings to figure out
✓ Professional appearance impresses clients
The Bottom Line: It's "just" a volume indicator - but it makes every other volume indicator look outdated. The gradient effect alone will change how you view volume forever.
⚠️ For educational purposes only. Trading involves risk.

Volumes (with MA indicator)This indicator provides a comprehensive volume analysis packed with features to enhance your trading decisions:
- Volume Bars Colored by Price Action: Volume bars are colored green or red based on the relationship between current and previous closes for intuitive trend awareness.
- Moving Average on Volume: Displays dynamic moving averages of volume on daily or weekly timeframes helping gauge volume trends.
- Low Relative Volume Highlighting: Spot volume bars with the lowest relative volume for deeper insight.
- Volume Peaks and Labels: Marks highest volumes and volume spikes using customizable labels, including volume change percentages and shares counts.
- Volume Buzz Indicator: Visual indication of volume momentum with colored buzz plots.
- Volume Statistics Table: Displays average volume, average dollar volume, volume up/down ratio, and real-time volume stats in a convenient table on the chart.
- High Customizability: Multiple input options to tailor colors, sizes, labels, and data to your preferences.
52SIGNAL RECIPE Hidden Volume52SIGNAL RECIPE Hidden Volume
◆ Overview
52SIGNAL RECIPE Hidden Volume is an innovative indicator that visualizes the hidden buying and selling strength behind the conventional volume candles. By analyzing the relative proportion of buying and selling within each candle’s price range, it splits the total volume into buy volume and sell volume. Displayed as color-coded bars (blue for buying, pink for selling) in a separate panel below the chart, it provides clear insight into the market’s buying and selling pressure.
Unlike standard volume indicators that only show total volume, this indicator reveals the underlying balance and shifts in buying and selling power, offering traders a deeper understanding of market dynamics.
Furthermore, when viewed alongside the traditional volume candles that everyone commonly uses, it helps traders interpret price movements and volume flows more comprehensively, enabling a more insightful analysis of overall market trends.
─────────────────────────────────────
◆ Key Features
- Buy/Sell Volume Ratio Analysis: Calculates the relative buy and sell ratios based on the candle’s price movement range
- Hidden Buying and Selling Strength Visualization: Separately displays buy volume (blue) and sell volume (pink) as stacked bars in a dedicated bottom panel
- Real-time Data Reflection: Captures immediate changes in market buying and selling pressure based on live volume data
- Clear Visual Distinction: Uses background shading to easily highlight periods of buying dominance (blue) or selling dominance (pink)
- Quantified Buy/Sell Balance: Displays the current buying vs selling ratio numerically on chart labels for quick reference
- Recommended Use with Traditional Volume Candles: Designed to be used together with commonly used volume candles for more comprehensive market flow interpretation
─────────────────────────────────────
◆ Trading Application Points
- Provides deeper insight into market sentiment compared to conventional volume bars
- Helps identify shifts in buying and selling power indicative of trend continuations or reversals
- Useful as a complementary tool alongside price action to better time entries and exits
─────────────────────────────────────
◆ Synergy With Other Indicators
- Combine with trend indicators (RSI, MACD, Moving Averages) to validate trend strength and momentum
- Use together with volume and order flow tools to enhance understanding of market participant behavior
─────────────────────────────────────
◆ Conclusion
52SIGNAL RECIPE Hidden Volume is a powerful and intuitive tool that unveils the balance of buying and selling forces concealed within the total volume. By visualizing buy and sell volumes separately and updating in real-time, it allows traders to grasp the subtle shifts in market pressure and make more informed trading decisions.
Especially when used together with the traditional volume candles commonly referenced by most traders, it enhances traders’ ability to interpret price movement combined with volume flow in a more multi-dimensional and precise way, ultimately supporting more effective trading strategies.
─────────────────────────────────────
※ Disclaimer: This indicator is provided as a supplementary analysis tool and should not be used as the sole basis for trading decisions. Past data does not guarantee future results. Always apply proper risk management.
52SIGNAL RECIPE Hidden Volume
◆ 개요
52SIGNAL RECIPE Hidden Volume은 일반적인 볼륨 캔들 뒤에 숨겨진 매수와 매도의 힘의 크기를 가시화하는 지표입니다. 각 캔들의 가격 움직임 범위 내에서 매수와 매도의 상대적인 비율을 계산해, 총 거래량을 매수 볼륨과 매도 볼륨으로 나누어 보여줍니다. 별도의 차트 하단 패널에 파란색 매수 볼륨과 분홍색 매도 볼륨을 컬러 막대 그래프로 시각적으로 구분하여 시장 내 거래 심리와 매수·매도 압력을 명확하게 파악할 수 있도록 지원합니다.
일반 거래량 지표가 단순한 거래량 수치만 제공하는 반면, 이 지표는 매수세와 매도세의 숨겨진 균형과 변화를 직관적으로 보여줘, 시장 내부의 매매 강도와 방향성을 깊이 있게 이해하는 데 유용합니다.
또한, 일반적으로 모두가 사용하는 볼륨 캔들과 함께 병행해 보면, 가격 변동과 거래량의 흐름을 더 입체적으로 분석할 수 있어서 시장 전체의 흐름을 해석하는 데 훨씬 용이합니다.
─────────────────────────────────────
◆ 주요 특징
- 매수·매도 거래 비율 분석: 캔들의 가격 변동 범위를 기준으로 매수와 매도 비율 산출
- 숨겨진 매수·매도 힘 시각화: 별도 차트 하단 패널에서 매수 볼륨(파란색)과 매도 볼륨(분홍색)으로 구분하여 가시화
- 실시간 반영: 실시간으로 변하는 거래량 데이터에 기반해 시장 내부 매수·매도 압력 변화 즉시 포착
- 심플한 시각적 구분: 색상과 배경으로 매수 우세 또는 매도 우세 구간을 직관적으로 표시
- 매수·매도 힘의 균형 이해 지원: 차트 상단 텍스트 라벨로 현재 매수/매도 비율을 숫자로 제공
- 볼륨 캔들과 병행 사용 권장: 모두가 사용하는 기본 볼륨 캔들과 함께 보면서 시장 흐름 해석에 활용 가능
─────────────────────────────────────
◆ 트레이딩 활용 포인트
- 기존 거래량 지표 대비 더 깊은 시장 심리 분석 가능
- 매수세와 매도세 간 힘의 균형 변화를 주목하여 추세 전환이나 지속 신호로 활용
- 가격 흐름과 결합해 진입 및 청산 타이밍 설정에 도움
─────────────────────────────────────
◆ 다른 지표와 조합 가능성
- 가격 추세 지표(RSI, MACD, 이동평균선 등)와 함께 사용해 추세 강도와 매수·매도 압력 동시 분석
- 거래량 및 주문장 지표와 결합하여 시장 참여자 심리 및 매매 동향 파악 강화
─────────────────────────────────────
◆ 결론
52SIGNAL RECIPE Hidden Volume은 일반 볼륨 캔들만으로는 알기 어려운 매수와 매도 간의 힘의 균형을 명확히 보여주는 강력하고 직관적인 지표입니다. 실시간 거래량 내 매수·매도 비율을 분리해 시각화함으로써, 트레이더들이 시장 내부의 숨겨진 힘의 흐름을 이해하고 이를 바탕으로 한 전략적 의사결정을 내릴 수 있도록 돕습니다.
특히 일반적으로 많이 사용하는 볼륨 캔들과 함께 병행하여 볼 때, 가격 변동과 함께 시장의 거래 심리를 더욱 입체적이고 정확하게 해석할 수 있어 훨씬 효과적인 매매 전략 수립이 가능합니다.
─────────────────────────────────────
※ 면책 조항: 본 지표는 투자 판단을 위한 보조 도구로 제공되며, 단독 의존해서는 안 됩니다. 과거 데이터에 기반한 분석이므로 미래 결과를 보장하지 않으며, 적절한 리스크 관리와 함께 사용하시기 바랍니다.

Pristine Volume AnalysisThe Pristine Volume Analysis indicator organizes volume, liquidity, and share structure data, allowing users to quickly gauge the relative volume a security is trading on, and whether it is liquid enough to trade🏆
Volume is an important metric to track when trading, because abnormally high volume tends to occur when a new trend is kicking off, or when an established trend is hitting a climax.
Track only the most important metrics, reducing mental clutter and noise:
▪ Volume run rate - Candle volume/ Avg candle volume
▪ Security liquidity - Average volume and average dollar volume
▪ Float rotation - Candle volume/ Float
This script automatically detects and flags the following conditions on volume bars:
▪ High volume run rate buying/selling based on user-defined thresholds
▪ HVE (highest volume ever) & HVY (highest volume in a year)
▪ High float rotation based on user-defined thresholds
Settings and Preferences
Customize this script based by setting preferred colors and thresholds:
Custom Alerts on HVE and HVY
Set custom alerts on a single equity or an entire watchlist to receive notifications when volume hits HVE or HVY.
Screen for HVE or HVY
Using the Pine Screener, scan watchlists for equities that have reached HVE or HVY.
Note: The Pine Screener is limited to calculations on the last 500 bars. If a symbol has less than 500 bars and has reached HVE, it will be included in the screener results. All symbols with more than 500 historical bars will not be included in the scan.
Volume Analysis Use Case : Confirming a breakout (1/3)
A high volume run rate as a stock breaks out to new highs can confirm a change of character and increase the odds of success on long setups. SMCI put in an HVE candle in January '24, sparking a super-performance run.
1-Month follow-through +137%
SMCI had plenty of gas left in the tank after putting in it's first HVE candle. The rest is history!
Volume Analysis Use Case : Gauging sentiment (2/3)
When a stock advances on repeated high run rate volume and an increasing angle of ascent (parabolic) , it can be a good indication that sentiment is overheated and it is time to reduce exposure to the stock.
Note:25% is the default float rotation threshold. This value can be customized based on your own trading style and preferences.
Following the parabolic ascent on high volume run rate and float rotation, HIMS topped, falling ~67% over the next two months!
Volume Analysis Use Case : Passing on a meme stock (3/3)
High float rotation often goes hand-in-hand with high stock volatility. One might opt out of trading a stock if it is outside their risk tolerance.
Smart VolumeThis script introduces a unique approach to volume analysis by combining three critical components that work together to identify institutional activity:
1. Adaptive Volume Analysis
- Automatically calculates significant volume thresholds specific to each stock (current bar volume compared to the average of previous 6 bars)
- Unlike standard indicators using fixed multipliers (like 2x average volume), this adapts to each stock's unique trading characteristics
- Example: A 2x volume spike might be significant for AAPL but irrelevant for a volatile small-cap
2. Volume Contraction Pattern (VCP) Detection
- Identifies periods of decreasing volume with precise criteria:
• Requires 6+ consecutive periods of declining volume
• Volume must compress by at least 20% from peak
• Price must remain within a defined channel
- Automatically detects completion of compression patterns
3. RVM (Relative Volatility Measure) Integration
- Measures current volatility against historical averages
- Identifies low-volatility periods that often precede major moves
- When combined with volume compression, signals higher probability setups
How Components Work Together:
- Volume spikes are evaluated against stock-specific thresholds
- VCP detection runs continuously to identify compression patterns
- RVM confirms volatility contraction aligned with volume compression
- When all three align, the indicator signals potential breakout entry
Usage:
1. Monitor volume bars for spikes above adaptive thresholds (bright green/red)|
2. Monitor average volume line turning from white to green indicating volume contraction (the brighter the green the more contraction happened)
2. Watch for green shading at the zero-line indicating volatility compression (RVM)
3. Use the statistics table for more insights
Original Features:
- First indicator to combine adaptive volume thresholds with VCP detection
- Implements stock-specific volume analysis instead of fixed multipliers
- Integrates volatility confirmation with volume patterns
- Provides real-time statistical analysis of compression patterns
Best suited for daily timeframes on liquid stocks where institutional activity is most visible.
Note: While patterns suggest potential moves, always confirm with price action before trading.
Video:
Volume Candle bollinger band By Anil ChawraHow Users Can Make Profit Using This Script:
1.Volume Representation: Each candle on the chart represents a specific time period (e.g., 1 minute, 1 hour, 1 day) and includes information about both price movement and trading volume during that period.
2.Candlestick Anatomy: A volume candle has the same components as a regular candlestick: the body (which represents the opening and closing prices) and the wicks or shadows (which indicate the highest and lowest prices reached during the period).
3.Volume Bars: Instead of just the candlestick itself, volume candles also include a bar or histogram representing the trading volume during that period. The height or length of the volume bar indicates the amount of trading activity.
4.Interpreting Volume: High volume candles typically indicate increased market interest or activity during that period. This could be due to significant buying or selling pressure.
5.Confirmation: Traders often look for confirmation from other technical indicators or price action to validate the significance of a high volume candle. For example, a high volume candle breaking through a key support or resistance level may signal a strong market move.
6.Trend Strength: Volume candles can provide insights into the strength of a trend. A series of high volume candles in the direction of the trend suggests strong momentum, while decreasing volume may indicate weakening momentum or a potential reversal.
7.Volume Patterns: Traders also analyze volume patterns, such as volume spikes or divergences, to identify potential trading opportunities or reversals.
8.Combination with Price Action: Volume analysis is often used in conjunction with price action analysis and other technical indicators to make more informed trading decisions.
9.Confirmation and Validation: It's important to confirm the significance of volume candles with other indicators or price action signals to avoid false signals.
10.Risk Management: As with any trading strategy, proper risk management is crucial when using volume candles to make trading decisions. Set stop-loss orders and adhere to risk management principles to protect your capital.
How the Script Works:
1.Identify High Volume Candles: Look for candles with significantly higher volume compared to the surrounding candles. These can indicate increased market interest or activity.
2.Wait for Confirmation: Once you identify a high volume candle, wait for confirmation from subsequent candles to ensure the momentum is sustained.
3.Enter the Trade: After confirmation, consider entering a trade in the direction indicated by the high volume candle. For example, if it's a bullish candle, consider buying.
4.Set Stop Loss: Always set a stop loss to limit potential losses in case the trade goes against you.
5.Take Profit: Set a target for taking profits. This could be based on technical analysis, such as a resistance level or a certain percentage gain.
6.Monitor Volume: Continuously monitor volume to gauge the strength of the trend. Decreasing volume may signal weakening momentum and could be a sign to exit the trade.
7.Risk Management: Manage risk carefully by adjusting position sizes according to your risk tolerance and the size of your trading account.
8.Review and Adapt: Regularly review your trades and adapt your strategy based on what's working and what's not.
Remember, no trading strategy guarantees profits, and it's essential to practice proper risk management and have realistic expectations. Additionally, consider combining volume analysis with other technical indicators for a more comprehensive approach to trading.
How Users Can Make Profit Using this script :
Bollinger Bands are a technical analysis tool that helps traders identify potential trends and volatility in the market. Here's a simple strategy using Bollinger Bands with a 10-point range:
1. *Understanding Bollinger Bands*: Bollinger Bands consist of a simple moving average (typically 20 periods) and two standard deviations plotted above and below the moving average. The bands widen during periods of high volatility and contract during periods of low volatility.
2. *Identify Price Range*: Look for a stock or asset that has been trading within a relatively narrow range (around 10 points) for some time. This indicates low volatility.
3. *Wait for Squeeze*: When the Bollinger Bands contract, it suggests that volatility is low and a breakout may be imminent. This is often referred to as a "squeeze."
4. *Plan Entry and Exit Points*: When the price breaks out of the narrow range and closes above the upper Bollinger Band, consider entering a long position. Conversely, if the price breaks below the lower band, consider entering a short position.
5. *Set Stop-Loss and Take-Profit*: Set stop-loss orders to limit potential losses if the trade goes against you. Take-profit orders can be set at a predetermined level or based on the width of the Bollinger Bands.
6. *Monitor and Adjust*: Continuously monitor the trade and adjust your stop-loss and take-profit levels as the price moves.
7. *Risk Management*: Only risk a small percentage of your trading capital on each trade. This helps to mitigate potential losses.
8. *Practice and Refinement*: Practice this strategy on a demo account or with small position sizes until you are comfortable with it. Refine your approach based on your experience and market conditions.
Remember, no trading strategy guarantees profits, and it's essential to combine technical analysis with fundamental analysis and risk management principles for successful trading. Additionally, always stay informed about market news and events that could impact your trades.
How does script works:
Bollinger Bands work by providing a visual representation of the volatility and potential price movements of a financial instrument. Here's how they work with a 10-point range:
1. *Calculation of Bollinger Bands*: The bands consist of three lines: the middle line is a simple moving average (SMA) of the asset's price (typically calculated over 20 periods), and the upper and lower bands are calculated by adding and subtracting a multiple of the standard deviation (usually 2) from the SMA.
2. *Interpretation of the Bands*: The upper and lower bands represent the potential extremes of price movements. In a 10-point range scenario, these bands are positioned 10 points above and below the SMA.
3. *Volatility Measurement*: When the price is experiencing high volatility, the bands widen, indicating a wider potential range of price movement. Conversely, during periods of low volatility, the bands contract, suggesting a narrower potential range.
4. *Mean Reversion and Breakout Signals*: Traders often use Bollinger Bands to identify potential mean reversion or breakout opportunities. When the price touches or crosses the upper band, it may indicate overbought conditions, suggesting a potential reversal to the downside. Conversely, when the price touches or crosses the lower band, it may indicate oversold conditions and a potential reversal to the upside.
5. *10-Point Range Application*: In a scenario where the price range is limited to 10 points, traders can look for opportunities when the price approaches either the upper or lower band. If the price consistently bounces between the bands, traders may consider buying near the lower band and selling near the upper band.
6. *Confirmation and Risk Management*: Traders often use other technical indicators or price action patterns to confirm signals generated by Bollinger Bands. Additionally, it's crucial to implement proper risk management techniques, such as setting stop-loss orders, to protect against adverse price movements.
Overall, Bollinger Bands provide traders with valuable insights into market volatility and potential price movements, helping them make informed trading decisions. However, like any technical indicator, they are not foolproof and should be used in conjunction with other analysis methods.

1. [Pufferman] - Comprehensive VolumeThis indicator presents a comprehensive approach to volume analysis, incorporating several key metrics to provide traders with a detailed view of market activity. Here's what's included:
1. Cumulative Relative Volume (Intraday): This metric accumulates volume data throughout the day, comparing it to historical session averages up to the current time. It's particularly useful for intraday analysis to determine if the stock is trading high or low volume before the day is over.
2. Real Relative Volume - This feature calculates the relative volume of a stock in comparison to the SPY, offering insight into whether a stock is trading with higher relative volume than the broader market.
3. Configurable Moving Average for Volume: Users can adjust the moving average period for average volume, allowing for flexible adaptation to different trading strategies and time frames. (green line in photo)
4. Above/Below Average Line: This line indicates whether the current volume bar exceeds or falls short of the session's average volume, providing immediate context for volume analysis. (red line in photo).
5. Volume Display in Abbreviations: Actual volume figures are presented in an abbreviated format, using "K" for thousands and "M" for millions, facilitating quick and easy analysis.
6. Color-Coded Relative and Real Relative Volume: Both the Relative Volume (RVOL) and Real Relative Volume (RRVOL) are color-coded to instantly convey volume concentration levels, enhancing visual analysis across multiple charts.
7. Volume Bars with Bullish and Bearish Highlights: Traditional volume bars are color-highlighted according to corresponding candle patterns, aiding in the identification of market sentiment.
Key Points:
The RVOL is a cumulative metric, considering time-of-day volume comparisons for intraday analysis. This approach offers a nuanced understanding of volume patterns specific to the timeframe being viewed.
The RRVOL provides a comparative analysis against the market, offering insights into stock-specific volume activity relative to market trends.
Note: This indicator is designed for intraday analysis and may not function as intended on timeframes above daily due to the cumulative nature of its volume calculations.

Volume [theEccentricTrader]OVERVIEW
This indicator simply bridges the gap between symbols from brokers that provide volume data and symbols from brokers that do not provide volume data. Users can select any symbol that provides volume data from the settings menu and the volume data will be displayed in histogram form on their current chart. The default volume symbol is CURRENCYCOM:US500.
CONCEPTS
Volume
Volume refers to the total number of shares or contracts that are traded during a given period of time. It is a measure of the amount of activity in the market and can be used to gauge the strength or weakness of a particular trend.
Volume is typically displayed as a histogram on trading charts, with each bar representing the total volume for a particular time period. High volume bars indicate a lot of trading activity, while low volume bars indicate relatively little trading activity.
Traders use volume in a number of ways. For example, they may use it to confirm a trend. If a stock is trending up and the volume is also increasing, this can be seen as a sign that the trend is strong and likely to continue. Conversely, if a stock is trending down and the volume is also increasing, this can be seen as a sign that the trend is weak and may be coming to an end. Volume can similarly be used to identify potential reversals. If a stock is trending up but the volume starts to decrease, this could indicate that the trend is losing momentum and that a reversal may be imminent.
FEATURES
Inputs
• Volume Symbol
Style
Users can change plot color and style from the default Style menu if so required.
NOTES
For 24-hour markets and forex volume I use the broker currency.com. As can be seen in the example above, I am using CURRENCYCOM:USDJPY to pull volume to a FOREXCOM:USDJPY chart, which otherwise would not show volume data as forex.com do not provide it.